Fieldbench User Guide
Serial and Modbus on one frame timeline — select any frame and the AI tells you what it is, what's wrong, and what to check next. This guide takes you from install to every feature.
0160-second quick start
Fieldbench runs without installing: download the portable zip, unzip, double-click — or run the installer. First launch doesn't greet you with an empty dashboard; it opens New connection right away:
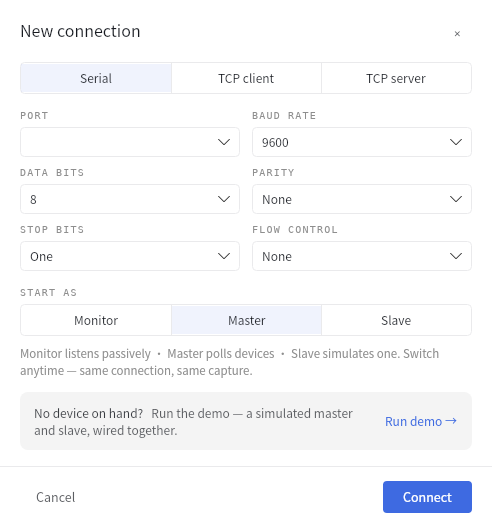
First-run dialog: any plugged-in USB-serial adapter is enumerated and pre-selected
02Connecting
Three connection types. Once connected, parameters are hot-editable in the top toolbar — change baud or parity and it applies instantly; the session and everything already captured stay put. You never delete and re-create a connection:
| Type | For | Parameters |
|---|---|---|
| Serial | 485/232 field buses, USB-serial adapters | Baud (standard rates or any custom value), data bits 5–8, parity N/E/O/M/S, stop bits 1/1.5/2, flow control |
| TCP client | Connecting to Modbus TCP devices / gateways | Target IP : port (502 default) |
| TCP server | Listening locally for TCP slave simulation | Listen port; multiple masters may connect at once |
Every successful connection is saved as a profile (PROFILES in the left rail) for one-click reconnect. Yanking the USB adapter mid-session won't crash anything — the session survives; plug back in and hit reconnect in the status bar.
03The three session types
One connection can host several sessions (views), all sharing the same byte stream:
| Session | What it does | Typical use |
|---|---|---|
| Monitor | Listens passively, transmits nothing | Clipping onto a live 485 bus to debug a production problem |
| Master | Actively polls devices | Reading/writing registers, verifying point maps, commissioning instruments |
| Slave PRO | Simulates a responding device | Building host software with no PLC on the desk |
04Reading the frame timeline
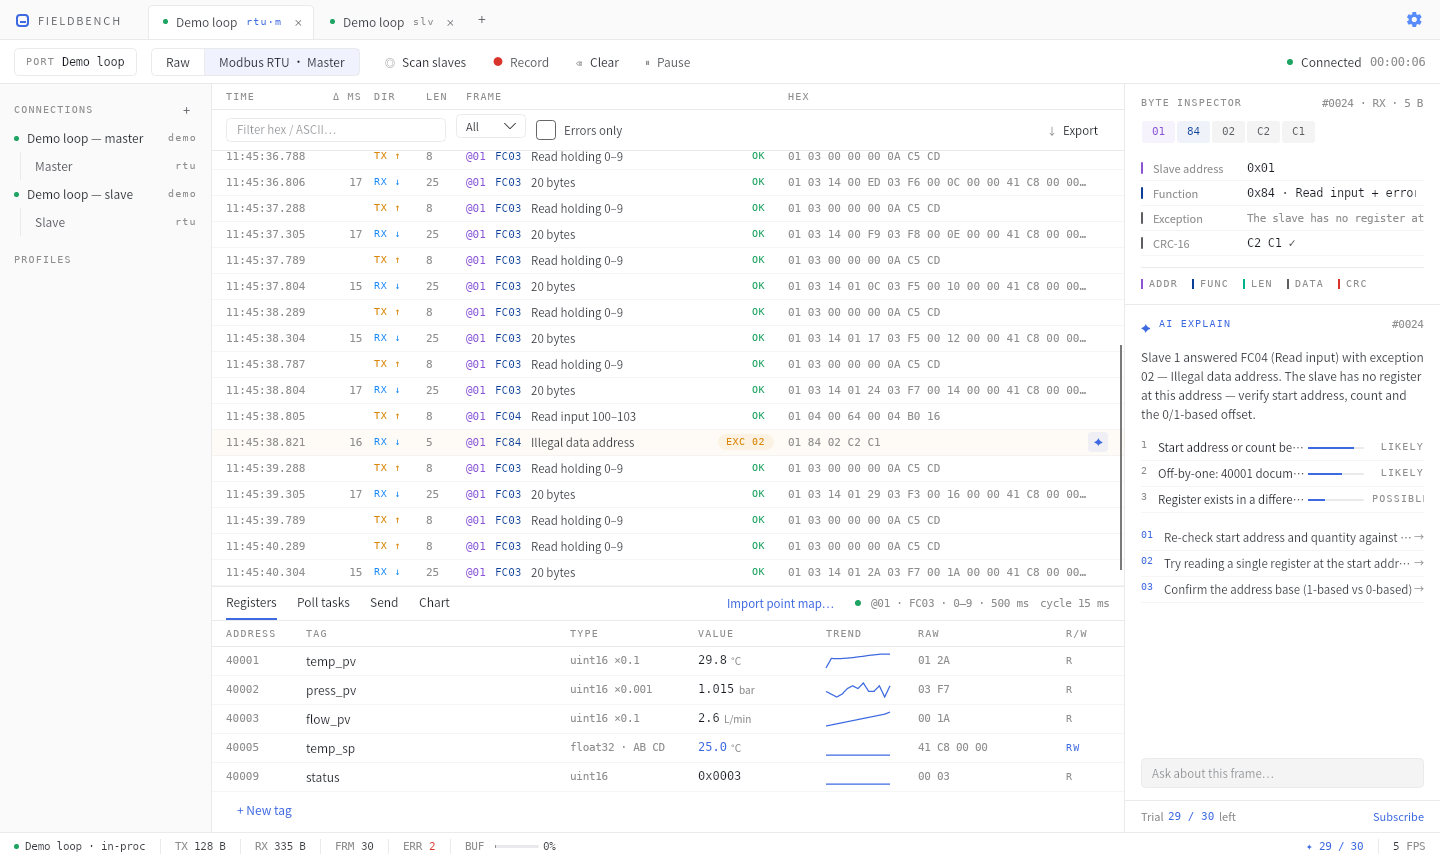
A Master session running: one CRC-failed frame selected, byte-level parsing and AI diagnosis in the right panel
One frame per row. The columns: Time (millisecond precision), Δ ms (request→response latency), Direction (TX↑ amber / RX↓ blue; on a passively monitored bus you get semantic direction, M→S / S→M), Length, parsed summary, raw hex.
Protocol fields use the same four colors everywhere in the product: slave address @01 function code FC03 length checksum / error. Row states read at a glance: exception responses tint amber with EXC 02, checksum failures tint red with CRC FAIL, and a ✦ icon appears at the row's end for one-click AI explanation.
Filtering & pause
- Filter bar: keyword (matches hex, ASCII, function code, slave address), direction All/TX/RX, errors-only
- Pause pauses rendering only — capture never stops. Scroll through history while new data keeps landing in the background
- Ring buffer defaults to 100,000 frames (adjustable in Settings)
Protocol auto-detect
On a Monitor/Raw stream, when 3 consecutive chunks pass CRC-16 validation (a single-frame coincidence is 1 in 65,536 — three in a row is certainty), a non-modal bar appears above the timeline: "Modbus RTU detected — 12/12 chunks pass CRC-16 · Switch lens". One click switches the lens and re-parses the full history. Random data will never trigger a false positive.
05Byte inspector
Select any frame and the top half of the right panel expands it byte by byte: each byte is colored by the field it belongs to, and hovering any byte shows the field name plus its decimal / hex / binary value. Below, the field list gives the item-by-item parse (slave address, function code, byte count, data, CRC — with the expected value shown whenever the checksum fails). With multiple frames selected (Ctrl/Shift click) the inspector shows the last one; AI explanation carries all of them.
06Modbus master
RTU and TCP, function codes 01 / 02 / 03 / 04 / 05 / 06 / 0F / 10; timeout and retry are per-connection (default 1000 ms × 3). The bottom panel has four tabs: Registers · Poll tasks · Send · Chart.
6.1 Register grid & writing values
- One tag per row: address (shown 40001-style, PLC convention), name, data type, live value, trend sparkline, raw hex, R/W attribute
- 8 data types:
bit / int16 / uint16 / int32 / uint32 / float32 / double / string; multi-register types support all 4 byte ordersAB CD / CD AB / BA DC / DC BA; scale and unit are configured per tag - Writing: blue values are writable — click, type, Enter. Fieldbench picks 05/06/0F/10 automatically, writes, and reads back to confirm; a failed write shows ⚠ with the reason inline
6.2 Poll tasks
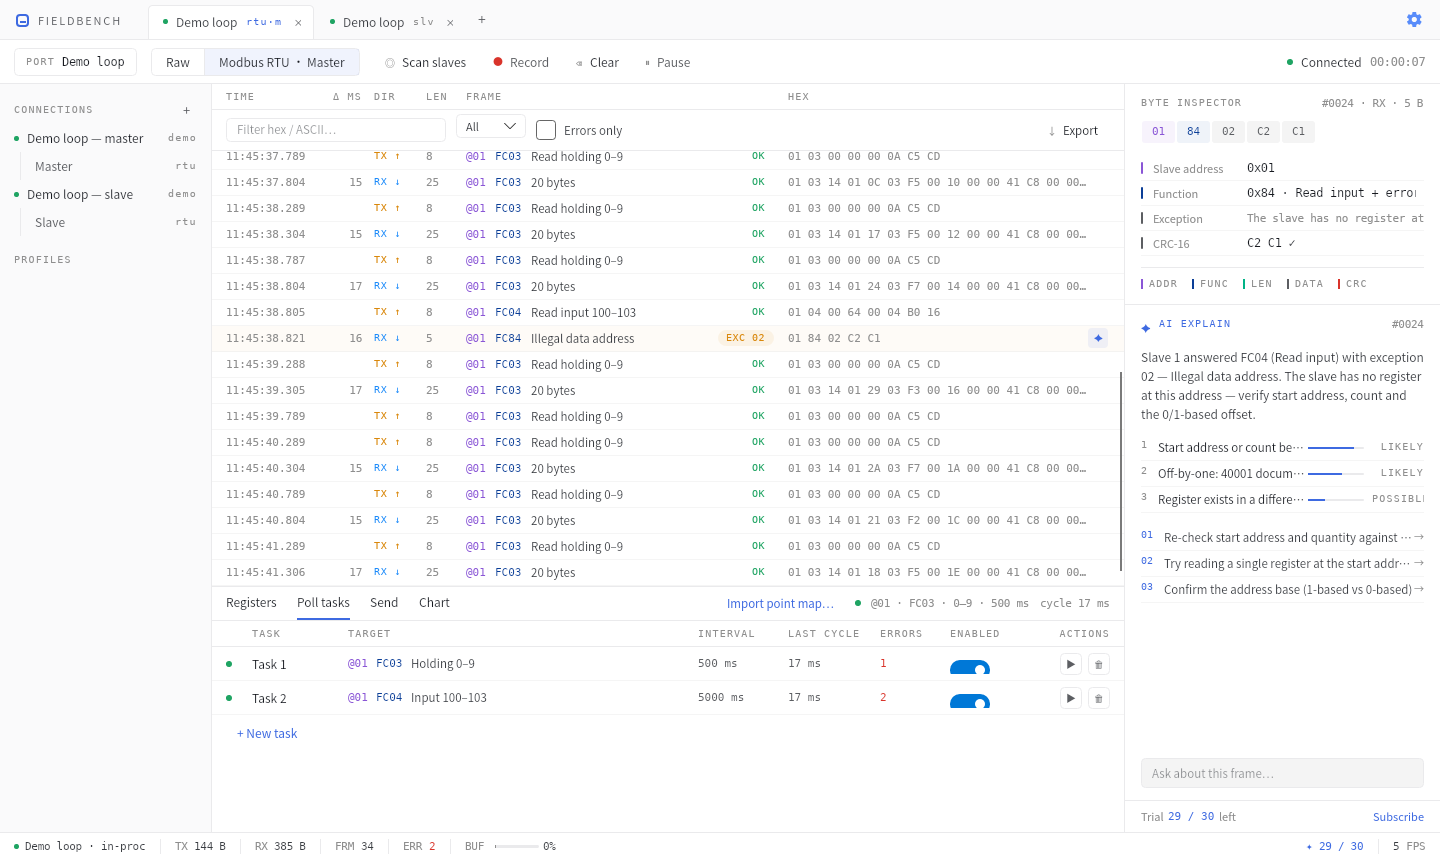
Define tasks in parallel; within one connection they're automatically scheduled serially, never colliding
Each task = slave address + function code + start address + quantity + interval. The switch starts and stops it; the row shows measured cycle time and error count; ▶ runs a disabled task once. Data from every task lands in the same register grid.
6.3 Slave scan
The first move when polls time out: Scan slaves in the toolbar walks addresses 1–247 (probe FC and timeout configurable, default FC03 × 200 ms) and lists responders with their response time — an exception reply still counts as alive (the device is on the bus; your address range is just wrong). On serial you can additionally sweep the common baud × parity matrix (~4 extra minutes). Found one? Open as Master in one click.
07Charts
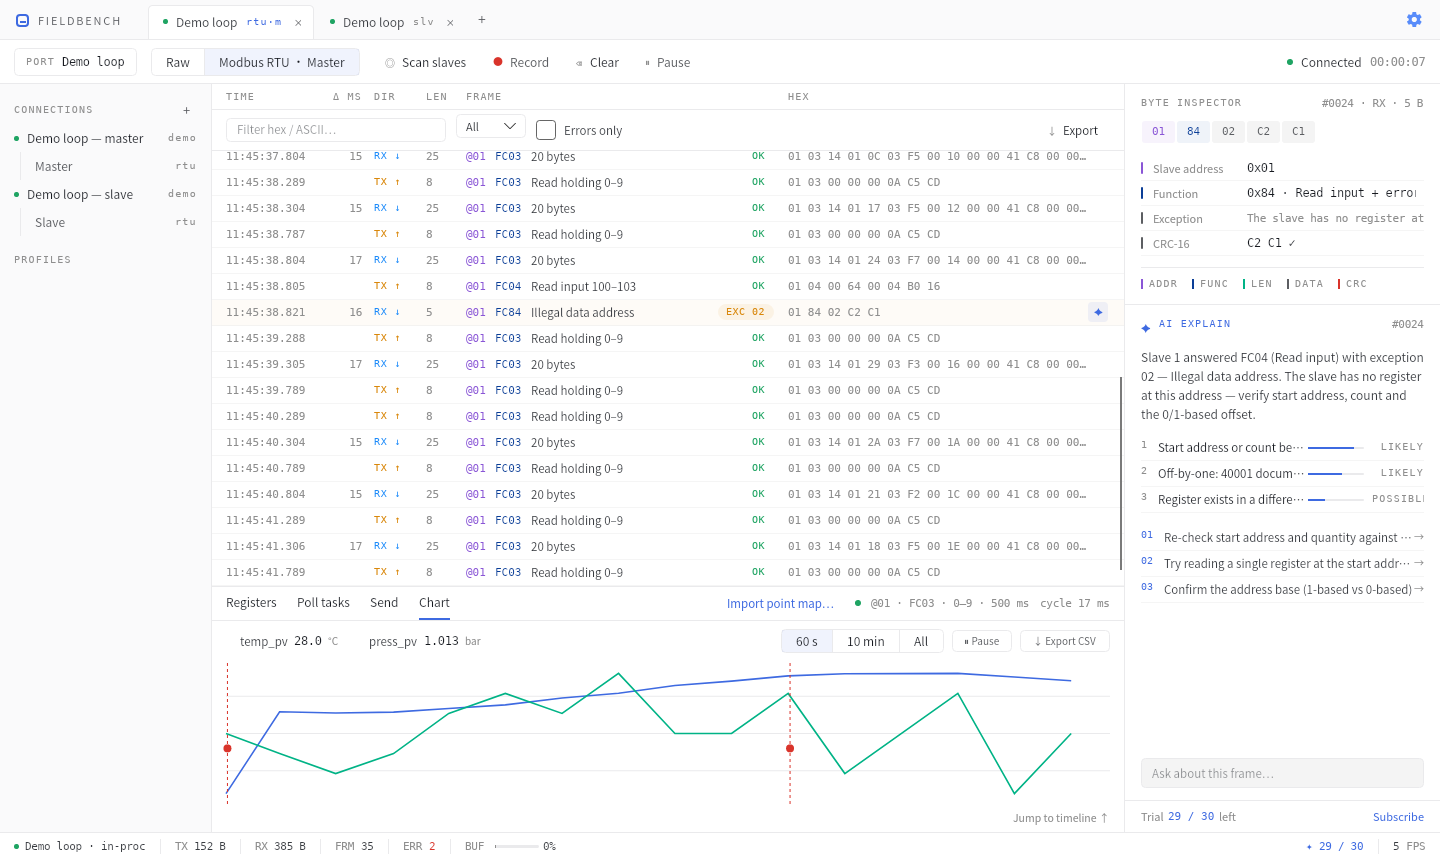
Faulty frames are pinned on the curve: click the red dot to jump back to that exact frame in the timeline
Numeric tags being polled become chart channels automatically (2 channels on FreeFREE, unlimited on Pro). Windows of 60 s / 10 min / all, pausable, CSV export. The chain value looks wrong → which frame → why is unique to Fieldbench: click the red anomaly dot on the curve, the timeline jumps to and selects that frame, then hit ✦ to have the AI explain it.
08Slave simulation PRO
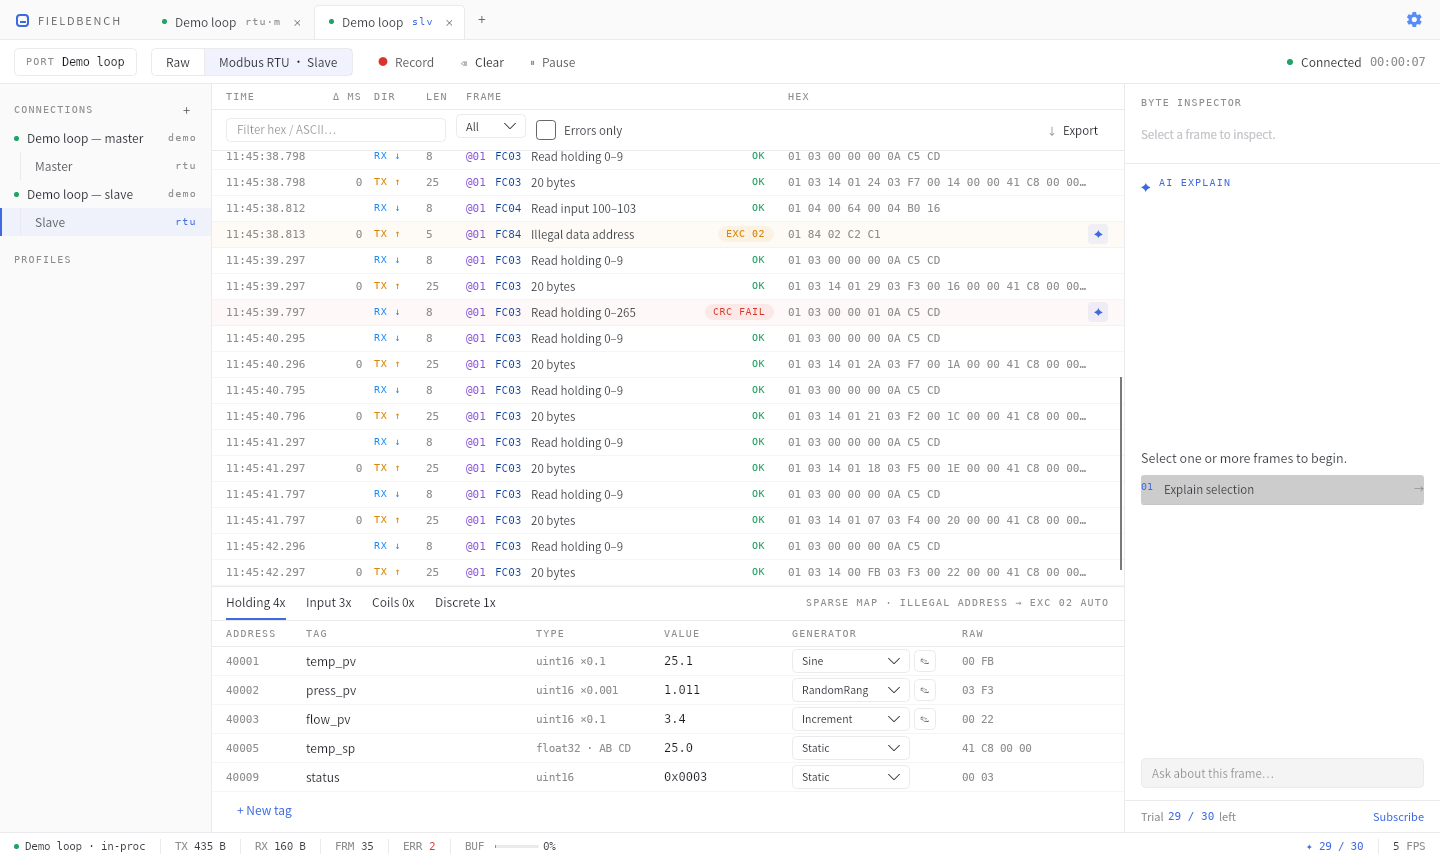
A TCP slave listening on :502 — requests and responses share the timeline; value generators make the data feel alive
- RTU (serial) or TCP (listening port, multiple masters may connect at once); unit ID configurable
- Four register-area tabs: Holding 4x · Input 3x · Coils 0x · Discrete 1x, a sparse 65,536-address space — only addresses you've defined exist; reads to undefined addresses answer
EXC 02, unknown function codes answerEXC 01, automatically - Value generators: each tag can be Static / Increment / Random / Sine — click ✎ to set amplitude, period, range, step. The classic "fake device with live data" for host-software developers
- Values written by a master show up in the grid instantly, marked written by client
09AI frame explanation
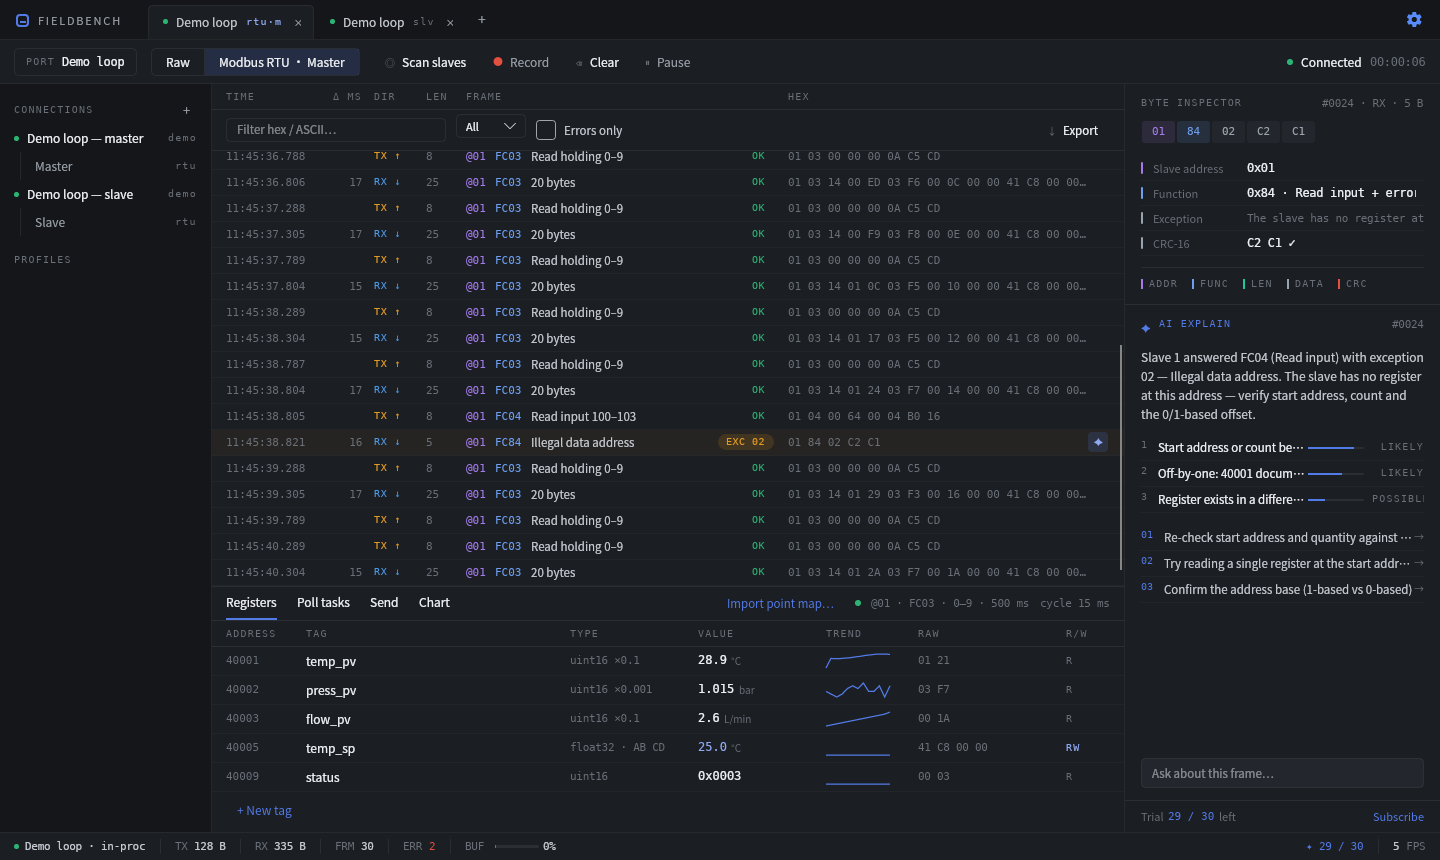
The AI always answers in the same shape: what this is → where it's wrong → causes ranked by likelihood → what to check next
Entry points: the ✦ icon at the end of any faulty row explains it in one click; or select 1–N frames and hit Explain in the right-hand AI panel. You can append your own question in the input box ("why does it fail every 30 frames?").
Five classes of trouble, each answered with engineer-grade direction:
| Scenario | What the AI tells you |
|---|---|
| CRC failure | Distinguishes single-bit wire noise / swapped CRC byte order / baud mismatch by their signatures, and shows the expected checksum |
| Exception codes 01–04 | Plain-language translation plus the checklist for each (e.g. EXC 02 → verify start address, quantity, 0-vs-1-based offset) |
| Screen full of garbage | Recognizes the byte-histogram signature of a wrong baud rate and suggests a parameter-matrix scan |
| Request, no response | Builds a checklist from your current connection parameters: slave address, A/B swapped, termination, baud… |
| A perfectly good frame | Explains every field — also a fine way to learn Modbus |
Privacy: a first-use dialog spells out exactly what gets sent — only when you press Explain: the selected frames, connection parameters and a ~20-frame summary of surrounding traffic. The gateway stores nothing; Settings has a live "preview what gets sent". Offline, the AI button simply grays out — everything else keeps working.
Quota: 30 free explanation trials included; the subscription ($6.9/mo) carries 1,000 per month. Your balance shows live in the status bar and at the bottom of the AI panel.
10AI point map import
Stop spending the first hour with a new device copying its manual by hand. Registers tab → Import point map…:
4xxxx · PLC, 1-based or 0-based protocol addresses. It's the #1 source of import mistakes, so the AI is never allowed to guess itTick Save device profile to also export a device-profile JSON — reuse it on the next unit of the same model, or hand it to a colleague. Quota: 3 free extraction trials; the subscription includes 30 per month.
11Export & recording
- Export: ↓ Export at the timeline's top right → CSV / JSON / raw bin / txt log. With frames selected it exports the selection, otherwise everything — hand last night's capture straight to the vendor in the morning
- Record: the red dot in the toolbar streams the capture to disk as it happens (appending text log); the ring buffer only feeds the screen, so an overnight stakeout never loses its early-morning fault to buffer wraparound
- Chart CSV: exported separately from the Chart tab (timestamp + one column per channel)
12Activating Pro
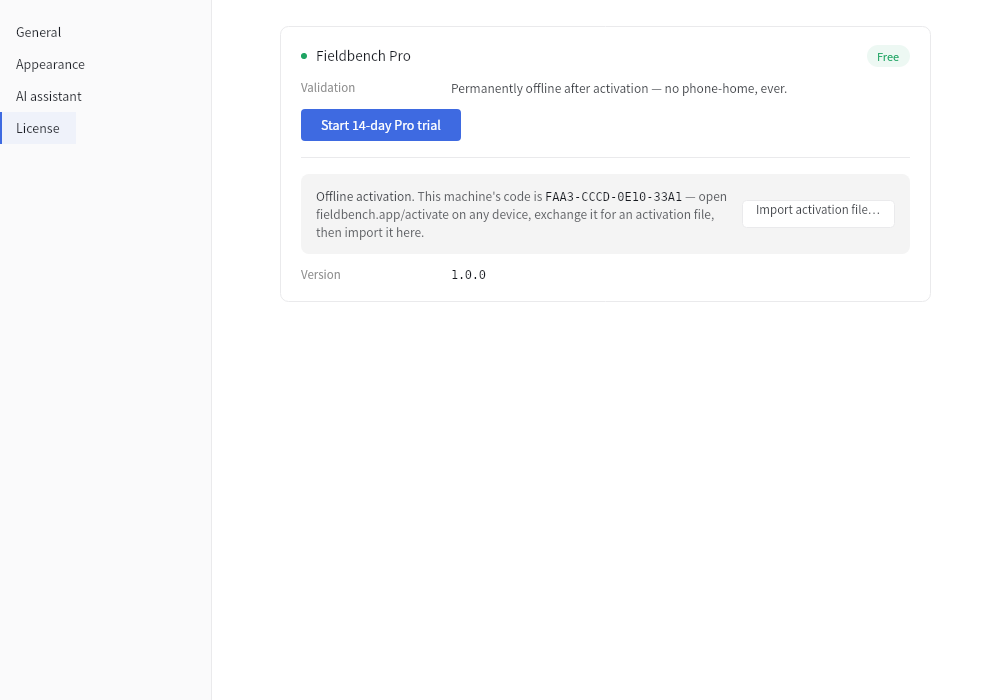
Settings → License: machine code, online activation and activation-file import all live here
| Edition | Includes |
|---|---|
| Free | 1 active connection · full Master with all function codes · full timeline/inspector · 2 chart channels · AI trial (30 explanations + 3 extractions) |
| Pro (one-time) | Unlimited connections · slave simulation · unlimited chart channels · priority support · 1 license activates 2 devices |
Every Pro feature comes with a 14-day full trial, no credit card — one click in Settings.
Online activation (with internet, 10 seconds)
Your license key (FB1-XXXX-XXXX-XXXX) arrives by email the moment you buy → Settings → License → paste the key → Activate. Done.
Offline activation (air-gapped machine on site)
8F3A-22C1-90DE-4471)13FAQ
The timeline is all garbage / CRC FAIL?
Nine times out of ten it's the wrong baud rate or parity. Select a few frames and hit ✦ so the AI reads the byte signature — or run Scan slaves with the parameter matrix ticked and let it try 9600–115200 × N/E for you.
Requests get no response at all?
In order: ① Scan slaves to confirm the address; ② swap the 485 A/B wires and retry (the #1 field culprit); ③ termination resistors; ④ baud/parity match the device. The AI's no-response checklist is generated from your current connection parameters.
Why is everything RX in Monitor?
Clipped passively onto a bus, the physical direction really is all receive. Switch to the Modbus lens and Fieldbench infers roles from frame semantics (request/response structure), showing M→S / S→M — and the Δ column becomes the bus's real response latency.
How do I do a loopback test?
Master ↔ Slave on one machine needs two connections (a com0com virtual serial pair, or TCP over 127.0.0.1). Free is limited to 1 connection, so this scenario needs Pro — or use Demo mode first, which shows the same thing.
Dark theme / Chinese interface?
Settings → Appearance. Theme and language (English / 简体中文) switch instantly, no restart.
Does any data leave my machine?
No. Except for the content you explicitly send when clicking AI Explain / Extract, not a single byte leaves the machine. Telemetry is off by default.